Data Literacy on the Shopfloor: Why More Data Does Not Automatically Lead to Better Decisions
OEE, scrap, rework and downtime are standard figures on many shopfloor boards. But the key question is not how many KPIs are available. It is: What do they tell us about the process – and what should we do next?
A drop in OEE, higher scrap or increased variation on one machine is an observation. It is not yet a root cause.
This is where Data Literacy matters: understanding data, putting it into context and turning it into reliable decisions.
Data: Understand the data first
Before interpreting a chart, teams need to know what was actually measured.
- How is the KPI defined?
- Which machine, shift or product does it represent?
- Are the periods and operating conditions comparable?
- Is the measurement system reliable?
A difference between two machines may mean very little if they were producing different products or using different materials.
Data Literacy therefore begins before advanced statistics. It starts with reliable data and the right questions.
For the broader perspective, see our article “Why Data Competence Is Essential for Successful Digital Transformation.”
Insight: Read charts without overinterpreting them
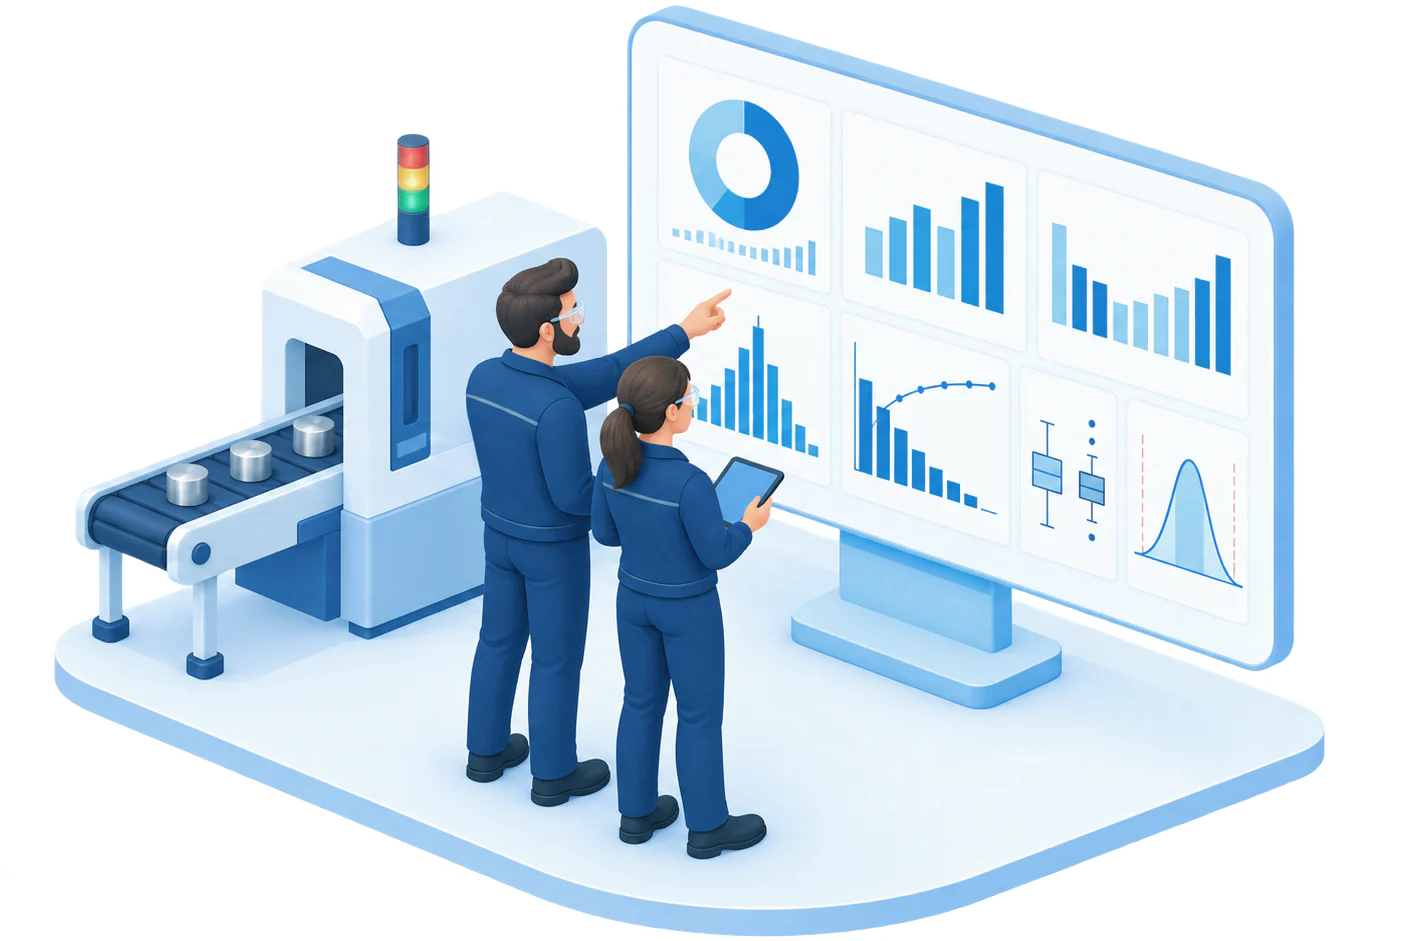
Visual methods help identify patterns quickly. They provide evidence for further investigation, not automatic explanations.
Histogram
Shows the location, variation and shape of a distribution. Several peaks, strong skewness or extreme values may indicate different process states, material batches or unusual events.
Pareto chart
Ranks defects or losses by frequency, cost, downtime or another relevant measure. This helps teams decide where improvement efforts may have the greatest impact. It prioritises the problem; root-cause analysis comes next.
Boxplot
Provides a compact comparison between machines, lines or shifts. Median, variation and unusual values become visible. The best process is not automatically the one with the lowest median, but the one that performs close to target with controlled variation.
Process capability – Cp and Cpk
Cp describes the potential capability associated with process variation. Cpk also considers the process position within the specification limits. A noticeable difference between the two may indicate that process centring needs attention.
These metrics should never be interpreted in isolation. Process stability, the measurement system and applicable specifications all matter.
These methods are also covered in our Statistical Methods Training.
Impact: Turn insight into action
The most important work starts after the analysis.
A shopfloor meeting should convert an observation into a testable next step:
Observation → hypothesis → owner → action → due date → effectiveness check
A Pareto chart may identify which problem deserves attention first. A boxplot may reveal meaningful differences between machines. Capability analysis may point towards process centring or variation as the next improvement area.
This turns KPIs from reporting tools into instruments for operational improvement.
Data Literacy is also a leadership capability
Effective shopfloor management therefore requires more than dashboards.
Leaders and teams need to recognise:
- what the data actually supports,
- when more information is required,
- when a relationship is not yet evidence of causation,
- which question should be asked next.
The goal is not to make every employee a statistician. It is to create a shared language around data and make decisions more transparent.
Our Data Literacy Training combines data understanding with practical KPIs, visualisations and real decision situations. For more complex challenges, we complement this with statistics, Lean Six Sigma and Consulting for Process Improvement & Operational Excellence.
From data to impact
A shopfloor can be highly digitalised and still produce poor decisions.
The difference is not the number of dashboards. It is whether people understand what the data shows, what it does not show and what action should follow.
Data provides the foundation. Insight makes patterns visible. Impact begins when that insight leads to a measurable improvement in the process